
speed
The current average driving speed in this direction. When the speed limit is close to 90, it is smooth. When it drops below 40, it usually means that the road ahead has started to be blocked.
Snow Mountain Tunnel real-time traffic condition signboard
Going south and going north are counted separately. Three numbers can determine whether to set off now and which road to cut before entering the tunnel.
The current average driving speed in this direction. When the speed limit is close to 90, it is smooth. When it drops below 40, it usually means that the road ahead has started to be blocked.

Estimated array length (km). This number reflects the traffic jam earlier than the vehicle speed - the vehicle speed has not dropped yet, but the queue is already getting longer.

Based on the traffic flow on both sides, it is determined whether to go left or right. Lane changes are prohibited in the tunnel, so decide before entering the tunnel.
The speed limit is 90 kilometers per hour and there are
The space between lanes in the tunnel is
There is no fixed answer, it depends on the current flow of traffic. Large vehicles are required to drive in the outside (right) lane, so there are often large vehicles on the outside and the speed is lower; but in traffic jams, the inside may also be slower. The upper signboard will directly give suggestions based on real-time vehicle speed and traffic flow status.
full length
Consecutive holidays and weekends
Speed and lane recommendations come from computer vision analysis of highway CCTV images, not manual reporting or simply reposting official data. Below is the entire process.
Current status:看板數值為展示用範例資料;即時分析管線正在整合中,尚未上線。
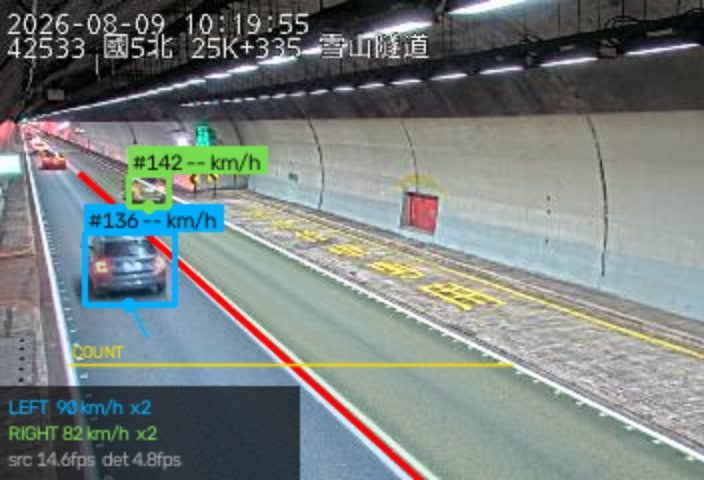
Actual output of the analysis program (China 5 North 25K+335)
Frame the cars, motorcycles, buses and trucks in the picture frame by frame. The resolution of highway CCTV is only 352×240, and cars in the distance often have less than 20 pixels. Therefore, the detection threshold must be lowered, and subsequent geometric checks can be used to filter out misjudgments.
Merely framing a vehicle cannot calculate the speed - you must know where the "same car" is in the front and rear frames. The tracker is responsible for assigning a fixed ID to each vehicle so that the displacement is meaningful.
A single shot has no depth information. Assuming that the road surface is a plane, the displacement on the screen can be restored to the actual distance on the road surface by using the vanishing point where the lane lines intersect and the standard lane width of the national highway.
Taking the central double white solid line in the tunnel as the boundary, the vehicle falls on whichever side of the line belongs to which lane. The speed and volume of vehicles are counted in the two lanes respectively.
Speed is the slope of time versus distance. The detection frame will jitter at low resolution, so take the median of the slopes of all sampling points instead of the least square - the median will not be pulled away by a single jump point.
No pass rate judgment is required. Because flow rate is equal to density multiplied by speed, "low passing rate" may mean that it is empty and smooth, or it may be that it is too crowded to pass. Instead, it will be based on the average number of vehicles in the lane. If the speed difference is too large, it will be directly rejected by the vehicle speed.
The vehicle speed is an estimate of the monocular camera, which will be affected by calibration errors. It is for reference only before traveling and is not equivalent to the official speed measurement data.
The source of road condition data is traffic information published by the highway authorities. The values are system estimates and are for reference only before traveling. Please refer to on-site signs and traffic control.